Monday, 29 November 2010

Ordnance Survey shows property sector can improve with location data

An interesting piece of research has just come out from the Ordnance Survey claiming that as much as 36% of people don’t think they make the most of location data in the property sector.


The survey further reveals that the sector is tackling the economic downturn by improving efficiency and cutting costs rather than by cutting fees.  We have picked out some of the main findings from this survey of 270 property professionals.

Dealing with the downturn:
  • 81% see cost cutting and increasing efficiency as the two most important strategies for dealing with the economic downturn
  • A smaller minority (33%) think that reducing prices or fees is the way to tackle current economic challenges
  • Environmental issues are more worrying to architects than property developers: Only 25% of property developers cite environmental issues as a key pressure for business, compared with 46% of architects

Using location data:
  • Whilst 70% use location data predominantly for project planning, 81% consider geographic and location context to be important, very important or essential to business strategy and planning
  • 80% of property developers see location data as very important or essential
  • 97% see the importance of location data increasing or remaining constant and of the respondents who forecast a change in the way that location data is used (32%), 61% forecast an increase in usage
  • Despite this, 47% of engineers, 43% of housing associations and 41% of property advisors surveyed don’t think they are making the most of the location data that is available to them

Data requirements of the property industry:
  • Data relating to planning issues (81%) and land use (80%) are the key requirements for the sector
  • 61% need data on geographical features and boundary lines
  • In comparison to others in the sector, a larger percentage of housing associations rely on demographic profiling data (63%) and information on crime rates (43%)
  • Site location (88%) and planning proposals and applications (83%) constitute the primary use of location data. 70% of the sector will also use the data in design and construction
  • 33% used location data for the purposes of data analysis; however this seems to be more prominent in larger companies with 53% of companies of more than 100 people using it for this purpose, compared to only 29% of companies of under 100 people
Clearly location data is becoming increasingly important when it comes to decision making in the property sector. If you are one of the 36% of people who don’t use location data to its full potential, there are many opportunities to explore, including data analysis for property developers and providing multi-dimensional data on city sites for architects.

FIND provides a host of location data to underpin and support the property sector for more effective business. FIND’s most popular maps, datasets and reports include:

Maps to view, print and export
OS MasterMap 1:1250
Street detail 1:10 000
Locale 1:25 000

Location data to view print and export
Listed buildings
Built heritage sites (Scheduled monuments, World heritage sites, Parks and gardens Battlefields)
Planning application locations
Environment Agency Flood Constraint map
Conservation areas maps
Boundaries (Parishes, Ward, Electoral division, Constituencies (with Member of Parliament name and website link), Local authority district, County)
Postcodes (Including districts and areas)
London Building Heights

Location reports
Historical maps report
Underground Utilities report
Professional commercial flood risk report

Monday, 22 November 2010

Happy 175th Birthday British Geological Survey (BGS)

The Icelandic volcanic eruptions of  2010 demonstrated how much we still need long-term observations of natural events. The BGS (British Geological Survey) has now been providing geological information underpinning the economy and the well-being of people in Britain for 175 years.

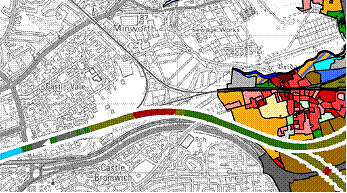
Above, sample of BGS 1:10000 scale geology map for Keyworth, Nottingham, UK

The BGS maintains a treasure trove of carefully collected and catalogued specimens and field observations, producing a fundamental work of reference and cutting-edge research. The BGS’s National Geoscience Data Centre (NGDC) functions as the national collection of geoscientific environmental data and information. It contains the most comprehensive collection of information on the surface and subsurface of Great Britain and the surrounding continental shelf. The collection has been gathered over more than 175 years, and even includes some of Charles Darwin’s original specimens from the Galapagos and Ascension islands. The records held within the NGDC comprise over nine million items dating from the eighteenth century to the present day. The total collection occupies over 11 kilometres of shelving with digital storage comprising approximately 195 terabytes. Examples of the digital collections include 22.25 terabytes for maps and 0.5 terabytes for borehole records .

We at FIND are proud to offer many of the BGS’s data sets for commercial access. All data can be viewed and printed online, as well as exported in DWG, DXF, TAB, SHP formats.

Geology maps - large scale (1: 10 000) and small scale (1: 50 000)
Geological maps are useful to a wide range of businesses with interests in planning and development as well as more academic aspects such as the Earth’s geological history, its fossils and its landscape development. Map themes include, faults and rock segments; artificial ground; landslip deposits; superficial deposits; and Bedrock. More info>

Ground stability
The ground stability map layer is derived from geological mapping and is categorised to show areas that are liable to instability and so are potentially hazardous. It is valuable to any organisation that owns or manages property. Ground stability information is divided into six sub-layers: Collapsible deposits; Compressible deposits; Running sands; Slope instability; Soluble rocks; and Swell and shrink. More info>

Borehole index
This layer displays the locations and summary information for all onshore boreholes and water wells held by the British Geological Survey. More info>

Groundwater flooding / Susceptibility to Groundwater Flooding
The BGS's Susceptibility to Groundwater Flooding information displays areas where geological conditions could allow groundwater flooding to occur, and where groundwater may come close to the ground surface. Flooding of this type often lasts longer than river flooding and can result in significant social and economic disruption. More info>

River and coastal flooding / Geological Indicators of Flooding
The British Geological Survey's Geological Indicators of Flooding information is based on the Digital Geological Map of Great Britain at the 1:50 000 scale (DiGMapGB-50). This map shows the areas vulnerable to the two main types of flooding, inland floodplains and coastal plains / estuarine environments in Britain. More info>

Wednesday, 3 November 2010

Don’t underestimate the flood risk to your business

This November marks the 10th anniversary of the Great Autumn Floods of 2000 - the UK’s wettest period in since records began. Even as recently as last year, regions including Sheffield and Cumbria were devastated by floods.

Yet many businesses and organisations don’t appreciate the value of knowing their flood risk. With the onset of extreme weather events caused by global warming this risk and potential impact is likely to increase over time.


Above, map displaying EA Flood Zones in Great Yarmouth, East Anglia. Deep blue represents Flood Zone 3, light blue represents Flood Zone 2

It's easy to underestimate the impact of flooding without the right data, maps and intelligence. Many firms often associate hazardous flooding only with rivers and the sea; they don’t think that they’re at risk from surface water flooding. This can result from something as seemingly minor as a nearby ditch or stream. However, in the summer of 2007, sixty percent of insurance claims related to damage caused by flooding arising from surface water.

Those with business premises or who need to asses them have a number of maps, data and reports to help determine the likelihood that the building will sustain major damage in the event of flooding. These tools are essential for ascertaining whether the building is in an at-risk area and allowing precautions to be taken before  problems arise.

FIND offers Environment Agency (EA) and British Geological Survey (BGS) maps and data that can help determine flood risk. Much of this information is available to instantly download for the first time in the UK, you can also order information for small areas, making for a more efficient risk analysis.

EA and BGS data is viewable and printable online, or can be downloaded in DWG, DXF, TAB, and SHP formats. We also offer a variety of self contained reports.

See below for a compact summary of the flood risk information available.


Environment Agency / EA flood related maps and datasets

Flood constraints or Flood Zones - The EA Flood Zone maps are key to steering development toward areas of low flood risk. Flood Zone 2, for example, shows areas of land with an annual probability of flooding of 0.1% or greater from rivers and the sea, but with an annual probability of flooding of less than 1% from rivers or 0.5% from the sea. More info>

NaFRA / National Flood Risk Assessment - The Environment Agency's improved National Flood Risk Assessment (NaFRA) is the standard dataset for determining categories of flood risk in the insurance industry and is key in implementing the Association of British Insurers (ABI) flood agreement with the government. NaFRA provides an indication of flood risk by calculating the actual likelihood of flooding to areas of land within flood plains from an extreme flood (1 in 1000 in any given year). More info>

Historic Floods - The historic floods outline layer shows the individual footprint of every flood event recorded by the Environment Agency. It contains over 21,000 records going back to 1947. More info>

Flood Defences - EA record of the location, condition and design of flood defences in England and Wales that reduce the risk of flooding from main rivers and the sea. More info>

Flood Defended Areas - This dataset contains areas that benefit from flood defences during an event of equivalent magnitude to an event that would present a 1% annual chance of fluvial flood and 0.5% annual chance of tidal flood. More info>

Flood Storage Areas or FSA - Theses areas show zones that act as a balancing reservoir, storage basin or balancing pond. More info>

Detailed River Network / DRN - To assist in the duty of maintaining river quality in England and Wales, the EA have developed a fully attributed and topologically correct river network map, derived in part from OS MasterMap features. More info>


British Geological survey / BGS flood related maps and datasets

Groundwater Flooding -  BGS's Susceptibility to Groundwater Flooding information displays areas where geological conditions could allow groundwater flooding to occur, and where groundwater may come close to the ground surface. Flooding of this type often lasts longer than river flooding and can result in significant social and economic disruption. More info>

River and Coastal Flooding -  BGS’s Indicators of Flooding information is based on the Digital Geological Map of Great Britain at the 1:50 000 scale (DiGMapGB-50). This map shows the areas vulnerable to the two main types of flooding, inland floodplains and coastal plains / estuarine environments in Britain. More info>


Flood Risk reports

FloodInsight report from GroundSure - This is detailed data report for professionals assessing commercial flood risk. The GroundSure FloodInsight includes various detailed flood risk datasets including those from JBA for surface water (pluvial) flood risk; the Environment Agency and the British Geological Survey. More info>

Flood report from GroundSure - This provides clients with a cost-effective detailed assessment and understanding of the flood risk potential associated with residential property. More info>

For more information on our flood risk data go to our Flooding data package page or contact FIND support, tel : 0845 521 1410 or email: support@findmaps.co.uk

Wednesday, 27 October 2010

Is ActiveX stopping you from using online mapping on your Mac or PC? We have the solution

When an online mapping service crashes or fails to display maps properly many service providers blame you. They tell you that there’s something wrong with your ISP or the way your PC is set up.

The root of the problem, however, can frequently be found in the ActiveX software you are required to download in order to run some online mapping services. ActiveX will only work with a limited range of hosts - usually Windows in combination with Internet Explorer (IE). This means that whenever a new version of IE comes out you need to install an ActiveX update.

This problem was highlighted when Windows 7 was released. The ‘professional’ mapping service providers using ActiveX did not respond quickly enough and customers were left in limbo. They were given no idea of when the new operating system would be supported and eventually waited a month and a half before the problem was resolved. We are all busy enough already, surely this is a hassle we can do without.

The problems with ActiveX are magnified if you have to maintain it on a range of PCs. It will only ever work reliably on PC with a specific single combination of Windows and IE. Don’t bother to try using ActiveX on Firefox or Chrome – it simply won’t work. It won’t work on Linux or Macs either. So what’s the answer? Switch to a new mapping platform which doesn’t rely on ActiveX.

One of the reasons that FIND's online mapping platform is straightforward to use is that it doesn’t need ActiveX. Our technology uses Flash, a nifty programme that's automatically installed in over 95% of web browsers. We know that Flash is reliable. It’s behind powerful sites like the BBC and Youtube. FIND also works with Windows, Apple and Linux computers, as well as on Firefox, Chrome and IE web browsers. With FIND you don’t need to lift a finger or involve your IT department. We maintain the software and take care of updates and new releases behind the scenes, without you even noticing.

Register for FIND free here or find out more at findmaps.co.uk

Wednesday, 20 October 2010

Maps of High Speed Rail Link through Warwickshire

Earlier this year the Department for Transport announced the proposed route for a high speed rail link between Birmingham and London Euston. For about a third of its length the proposed route passes through Warwickshire.

Above, PDF of a background map with several geo-datasets layered over the top, including the proposed HS2 rail route through Warwickshire, property locations and ownership.

This will have a considerable impact on the area a major consultation is planned for next year. Following a chat with Mariam Crichton, Director of FIND, the team at Warwickshire County Council became excited about the prospect of using PDF mapping layers to inform that consultation process.

The team produced layered maps showing the proposed route of the rail link through the county. The maps show the locations of WCC property, ecological, archeological and historic landscape sites along the route. Also, the maps link to the detailed plans on the HS2 website.

Because PDF maps can be viewed regardless of hardware or operating system this makes them extremely accessible to the general public. In addition, they can be applied and viewed either individually or built up in layers. This gives much of the functionality of a sophisticated online mapping system, but at a fraction of the cost.

Using maps in this way has not only enabled the team at Warwickshire to inform the public about plans and the development of those plans, it has also allowed a broad range of interested parties to become involved in the process. The maps have also prompted people with detailed local knowledge to give valuable feedback. 

One of the team told us, "PDF maps have been of great help. We have had incredible user feedback from the public. It's a fantastic way to provide a wealth of mapping data in an easy to understand, accessible format. Users have even identified flaws which we have been able to correct."

At FIND we are delighted that the GIS team at Warwickshire County Council has used PDF mapping in such an innovative and imaginative way. Their work has helped to show the public what a powerful tool it can be.

HS2 WCC website

Monday, 18 October 2010

Avoiding the new conservation area constraints for estate agents

Recently, several Local Authorities have banned 'For sale' boards within conservation areas. In London this policy has already been adopted by several boroughs.

Kensington and Chelsea were the first to enforce the ban on 27th September shortly followed by Camden, Hammersmith & Fulham, and Westminster. The same restrictions currently apply in parts of Bath, Brighton, and Bristol; more Local Authorities are expected to follow suit.

Above, Conservation Areas over the FIND OS Plan map (OS MapsterMap Topography, 1:1250)

When new regulations like this are introduced it is essential that planners, developers and estate agents know about them. Failure to keep abreast of changes can result in additional costs and even legal action.

If you have the time to devote to searching for detailed information about how these restrictions apply you will find it no doubt tucked away on individual Local Authority websites. However, we know from experience that this can involve trawling through long and detailed planning documents - often emerging none the wiser about how your site is affected.

At FIND we have already done the searching for you. Our conservation area maps can be instantly viewed online, giving you the information you need to get on with the job in hand.

Conservation Areas on FINDmaps.co.uk
FIND offers conservation areas to view and print over ordnance survey maps.
Tell me more

Thursday, 7 October 2010

Ordnance Survey new pricing and licensing model

Last week the Ordnance Survey revealed phase one of its new pricing and licensing model, with phase two due out in the new year. The aim is to enable greater access to Ordnance Survey products and geographic datasets under a simplified structure.

Above, OS MasterMap on findmaps.co.uk 

A lot of time and effort has obviously gone into creating these changes; the new model means companies like FIND will have greater flexibility in how they can onward license Ordnance Survey products. This will encourage more organisations to go online and use desktop analysis as a routine part of their work. Ultimately, there will be an increase in the use of sophisticated professional online mapping tools like findmaps.co.uk.

The new licensing arrangements will allow FIND to be more flexible and imaginative in how we use data to create web solutions for our clients. We look forward to even more progress in this direction from Ordnance Survey.

FIND offers several OS products to view, print and export:

1:1250 MasterMap - OS Plan
1:1250 MasterMap - FIND Map
1:10000 Ordnance Survey map "Street View"
1:10000 Ordnance Survey map "Street detail"
1:25000 Ordnance Survey map "Locale"
1:50000 Ordnance Survey map "Town"
1:250000 Ordnance Survey map "GB"
Boundaries (Parishes, Ward, Electoral division, Constituencies' Local authority district, County)
Contours (Panorama 50m)
Contours (Profile 5m - 10m)
Postal addresses
Postcode areas
Postcode districts